COVID19
Data Input
covid_df = readxl::read_xlsx('MortalityDataWHR2021C2.xlsx') %>%
  drop_na() %>%
  janitor::clean_names() %>%
  mutate(
    death_change = all_cause_death_count_2020 - all_cause_death_count_2019)

covid_longer = covid_df %>%
  pivot_longer(
    all_cause_death_count_2017:all_cause_death_count_2017,
    names_to = "year",
    names_prefix = "all_cause_death_count_",
    values_to = "death"
  ) %>%
  mutate(year = as.numeric(year))

happy_df = readxl::read_xls('DataPanelWHR2021C2.xls') %>%
  janitor::clean_names() %>%
  select(1:3) %>%
  subset(
    country_name != "Kosovo" & country_name != "Somaliland region"
  ) %>%
  mutate(
    country_code = countrycode(country_name, "country.name", "iso3c")
  ) %>%
  relocate(country_code) %>%
  mutate(
    country_continent = countrycode(country_name, "country.name", "continent")
  ) %>%
  relocate(country_continent) %>%
  subset(year %in% c(2017,2018,2019,2020))

happy_df %>%
  group_by(country_continent) %>%
  summarize(n = n()) %>%
knitr::kable(col.names = c("Continent", "Number of Countries in Happiness Dataset"))| Continent | Number of Countries in Happiness Dataset |
|---|---|
| Africa | 138 |
| Americas | 77 |
| Asia | 150 |
| Europe | 151 |
| Oceania | 8 |
happy_wider =
  happy_df %>%
  pivot_wider(
    names_from = year,
    values_from = life_ladder,
    names_glue = "life_ladder_{year}"
  ) %>%
  mutate(happy_change_2020 = life_ladder_2020 - life_ladder_2019,
         happy_change_2019 = life_ladder_2019 - life_ladder_2018) %>%
  mutate(change_in_speed = happy_change_2020 - happy_change_2019)

covid_happy_trend =
  left_join(covid_df, happy_wider, by = "country_name") %>%
  drop_na()
COVID19 Distributions
covid_death_rate = covid_happy_trend %>%
  plot_ly(x = ~country_name,
         y = ~covid_19_deaths_per_100_000_population_in_2020,
         type = "bar", color = ~country_continent) %>%
  layout(
    title = "COVID19 Deaths per 100,000 Population in 2020 in Each Country",
    xaxis = list(title = 'Country Name'),
    yaxis = list(title = 'COVID19 Deaths per 100,000 Population'))

covid_death_rate
covid_happy_trend %>%
group_by(country_continent) %>%
summarize(n = n()) %>%
knitr::kable(col.names = c("Continent", "Number of Countries in both Happiness and COVID Dataset"))| Continent | Number of Countries in both Happiness and COVID Dataset |
|---|---|
| Africa | 1 |
| Americas | 6 |
| Asia | 10 |
| Europe | 30 |
| Oceania | 1 |
Change in Happiness Score Related to COVID19
covid_happy_trend %>%
  ggplot(aes(x = covid_19_deaths_per_100_000_population_in_2020,
             y = happy_change_2020)) +
  geom_point() +
  geom_smooth(method = "lm") +
  ggtitle("Plot of Relationship between COVID19 Deaths Rate and Increasees in Happiness Scores with Linear Regression Model") +
  xlab("COVID19 Deaths per 100,000 Population in 2020") +
  ylab("Increase in Happiness Score from 2019 to 2020")
## `geom_smooth()` using formula 'y ~ x'
covid_happy_trend_fc =
  covid_happy_trend %>%
  mutate(country_continent = factor(country_continent))

model = lm(happy_change_2020 ~ covid_19_deaths_per_100_000_population_in_2020, data = covid_happy_trend_fc)
summary(model)
##
## Call:
## lm(formula = happy_change_2020 ~ covid_19_deaths_per_100_000_population_in_2020,
## data = covid_happy_trend_fc)
##
## Residuals:
## Min 1Q Median 3Q Max
## -0.63023 -0.19340 0.01847 0.14833 0.90294
##
## Coefficients:
## Estimate Std. Error t value
## (Intercept) 0.0679156 0.0741398 0.916
## covid_19_deaths_per_100_000_population_in_2020 -0.0009279 0.0010276 -0.903
## Pr(>|t|)
## (Intercept) 0.364
## covid_19_deaths_per_100_000_population_in_2020 0.371
##
## Residual standard error: 0.3066 on 46 degrees of freedom
## Multiple R-squared: 0.01742, Adjusted R-squared: -0.003944
## F-statistic: 0.8153 on 1 and 46 DF, p-value: 0.3712We expected that COVID19 will decrease the happiness score. However, even though the regression has a negative slope, there is no significant relationship between covid-related death and happiness score. This may result from the lack of data. In our happiness dataframe, there are 166 countries. However, there are only 60 countries have both COVID data and happiness score. This mean only 36% of the total countries we are interested in have COVID data. Among the countries have data related to COVID, 33 countries are from Europe, which covers 55% of the dataframe. In details we have 33 out of 151 European countries (21.85%), 16 out of 150 Asian countries (10.67%), 9 out of 77 American countries (11.69%), 1 out of 138 African countries (0.72%) and 1 from 9 Oceanian countries (11.11%). Number of European countries is un-proportionally high compared to the country numbers in other continent. On the other hand, the number of African countries is the lowest. The disproportion could bring more developed countries than developing countries to our dataset because Europe is concentrated with developed countries while Africa is concentrated with developing countries. Therefore, the dataset we have may significant biased because developed countries may be more stable to epidemic impact. So the data we have right now cannot give accurate relationship result.
model = lm(happy_change_2020 ~ covid_19_deaths_per_100_000_population_in_2020 + country_continent, data = covid_happy_trend_fc)
summary(model)
##
## Call:
## lm(formula = happy_change_2020 ~ covid_19_deaths_per_100_000_population_in_2020 +
## country_continent, data = covid_happy_trend_fc)
##
## Residuals:
## Min 1Q Median 3Q Max
## -0.63111 -0.21188 -0.00395 0.13530 0.83869
##
## Coefficients:
## Estimate Std. Error t value
## (Intercept) -0.2256695 0.2987959 -0.755
## covid_19_deaths_per_100_000_population_in_2020 -0.0002485 0.0013796 -0.180
## country_continentAmericas -0.0204513 0.3458256 -0.059
## country_continentAsia 0.3260302 0.3135975 1.040
## country_continentEurope 0.2929524 0.3189358 0.919
## country_continentOceania 0.2780058 0.4225585 0.658
## Pr(>|t|)
## (Intercept) 0.454
## covid_19_deaths_per_100_000_population_in_2020 0.858
## country_continentAmericas 0.953
## country_continentAsia 0.304
## country_continentEurope 0.364
## country_continentOceania 0.514
##
## Residual standard error: 0.2988 on 42 degrees of freedom
## Multiple R-squared: 0.1477, Adjusted R-squared: 0.04627
## F-statistic: 1.456 on 5 and 42 DF, p-value: 0.2246After adding the continent variables, there is still no significant relationship. However, from the limit information, we can see that Americas are more likely to be effected by COVID19 because of the negatively relationship.
Change in Death Related to COVID19
covid_happy_trend %>%
  ggplot(aes(x = covid_19_deaths_per_100_000_population_in_2020,
             y = death_change)) +
  geom_point() +
  geom_smooth(method = "lm") +
  ggtitle("Plot of Relationship between COVID19 Deaths Rate and Total Death in 2020") +
  xlab("COVID19 Deaths per 100,000 Population in 2020") +
  ylab("Total Death in 2020")
## `geom_smooth()` using formula 'y ~ x'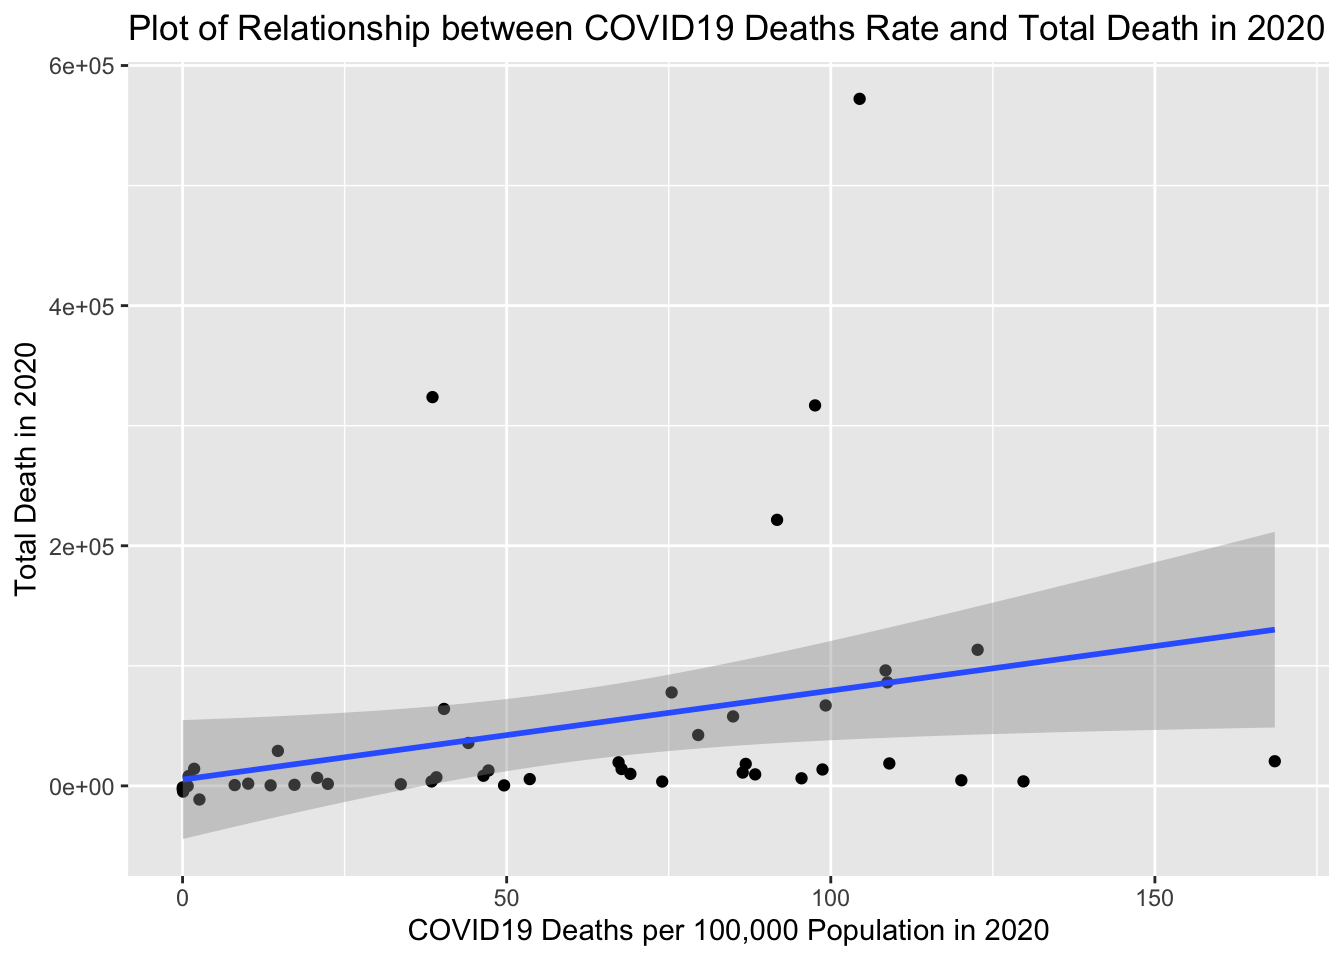
model = lm(death_change ~ covid_19_deaths_per_100_000_population_in_2020, data = covid_happy_trend_fc)
summary(model)
##
## Call:
## lm(formula = death_change ~ covid_19_deaths_per_100_000_population_in_2020,
## data = covid_happy_trend_fc)
##
## Residuals:
## Min 1Q Median 3Q Max
## -109594 -41445 -16015 -1543 489605
##
## Coefficients:
## Estimate Std. Error t value
## (Intercept) 5228.7 24608.7 0.212
## covid_19_deaths_per_100_000_population_in_2020 741.2 341.1 2.173
## Pr(>|t|)
## (Intercept) 0.833
## covid_19_deaths_per_100_000_population_in_2020 0.035 *
## ---
## Signif. codes: 0 '***' 0.001 '**' 0.01 '*' 0.05 '.' 0.1 ' ' 1
##
## Residual standard error: 101800 on 46 degrees of freedom
## Multiple R-squared: 0.09309, Adjusted R-squared: 0.07337
## F-statistic: 4.721 on 1 and 46 DF, p-value: 0.03497Covid-related deaths contribute to the total death as the slope 741.2 is positive. Based on that information, we also want to consider survivorship bias in the data. Since our data about happiness score is based on survey, people who were infected by COVID19 may had no access to the survey because they were hosptialized or dead. Therefore, the data we have may not have ability to reflect COVID19’s influence. This may explain why some European countries have high death rate related to COVID19 but still have positive changes in happiness scores.